Close
0%
0%

Op Art

Op amp circuit for generating Spirograph like curves

Similar projects worth following
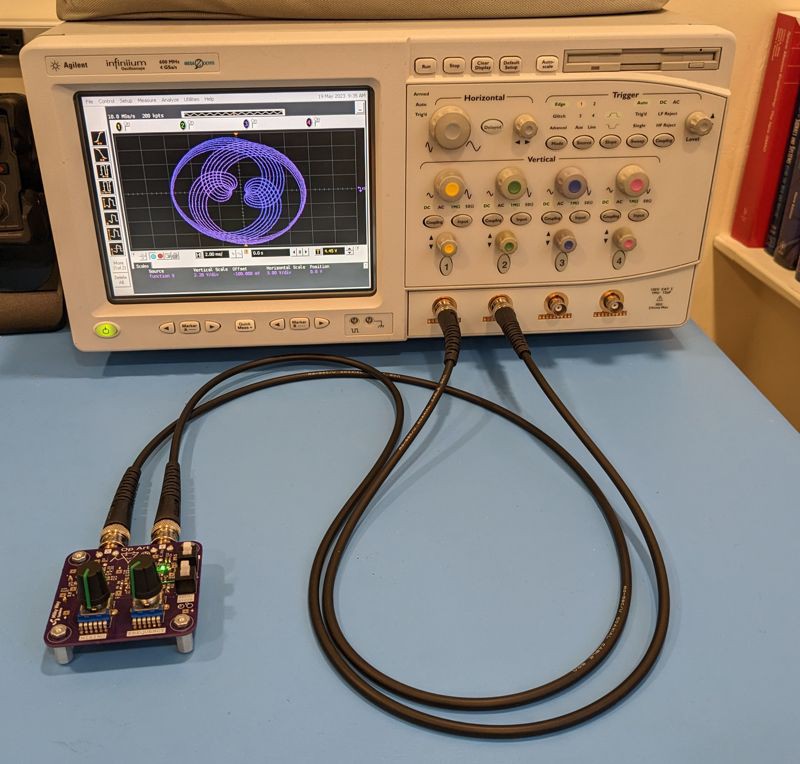
Op Art generates Spirograph like curves (known as hypotrochoids and epitrochoids) for viewing on an oscilloscope. It's implemented entirely with op amp circuits for the Op Amp Challenge and operates from two AAA batteries.

Introduction

Op amps are well known for their utilitarian prowess, performing many vital tasks underpinning analog circuit design.  They add, subtract, integrate, differentiate, and amplify with great precision!  

That’s all well and good… but how about the arts?  Can an op amp create a drawing?  That’s the essence of this project.  Let’s see what we can do!

At first glance, op amps don’t seem to be the right tool for the job.  But then they can perform mathematical operations, and math often generates visually appealing results.  Examples are fractals, Lissajous curves, and even the positioning of seeds in a sunflower blossom!  

For this project, we’ll focus on curves called hypertrochoids and epitrochoids.  These curves are produced by the well known Spirograph toy and produce all sorts of interesting patterns.  As it turns out they can be generated by summing sinusoids of various frequencies and magnitudes.  This is well within the capability of the mighty op amp!

Op Art's features include:

  1. Generates both hypotrochoids and epitrochoids
  2. Op amp & passive circuits only
  3. Battery operation - two AAA alkaline or rechargeable cells
  4. Display using oscilloscope - via two BNC test cables


Spiro-Math

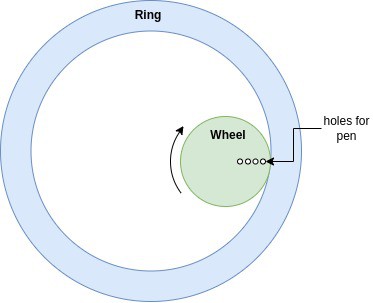
Op Art generates curves that can be created with the age-old Spirograph toy, which I had a lot of fun with as a child.  For those who are not familiar, a Spirograph toy has two main parts - a ring and a wheel.  The wheel has several holes into which a pen tip can be pressed.  You place the wheel inside the ring, set a pen tip in one of the wheel's holes, and then roll the wheel along the inner perimeter of the ring.  As the wheel rolls, it traces out a pattern.  You can change the pattern by moving the pen to a different hole in the wheel, selecting a different size wheel, or even rolling the wheel on the outer perimeter of the ring. There are gear teeth on both the ring and wheel which keep them from slipping.  The figure below shows the geometry of Spirograph.
To study the mathematics behind the Spirograph, we'll look at a simplified geometry shown below.  The geometry consists of a circle within another circle.  The inner circle rolls inside the perimeter of the outer circle without slipping.  The inner circle has a red point indicating the position of a pen.  The resulting curves traced out by the pen (red dot) are called hypotrochoids.
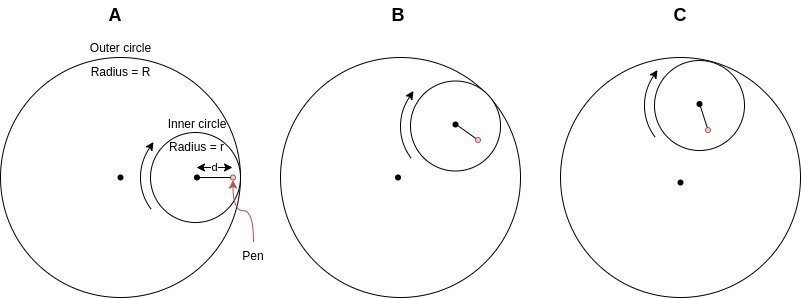
The inner circle's starting position is shown at left in column "A" of the figure above.  The inner circle is then rolled clockwise, reaching the position in column "B", then the position in column "C", and so on.

If you look closely at the diagram you might notice that the pen's path follows two connected line segments or vectors.  The first vector extends from the center of the small circle to the pen's position. It rotates clockwise around the center of the small circle.  The second vector extends from the large circle's center to the small circles center.  It rotates counterclockwise around the center of the large circle.  The two vectors, which we'll call O and I are shown below. 
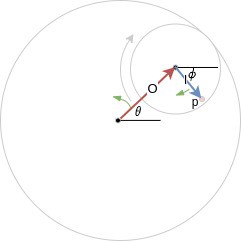


The pen position is simply the vector sum of O and I.  So if we can describe both vectors, we can calculate the path that the pen takes. The magnitudes of the vectors O and I are pretty straightforward to find.  I's magnitude is simply the pen position "d" defined in the previous figure.  O's magnitude is the outer circle radius minus the inner circle radius, or R-r.  

O's angle is defined as θ in the diagram.  I's angle is shown as ɸ, however, it is dependent on θ and the geometry of the Spirograph.  The relation between  θ and ɸ can be found by equating arc lengths on the inner and outer circles.  Reference [1] shows how, and provides the relation ɸ = θ * (R-r)/r. ...

Read more »
Zip Archive - 991.42 kB - 05/31/2023 at 15:27

Download

x-kicad-pcb - 1.03 MB - 05/31/2023 at 15:26

Download

Adobe Portable Document Format - 467.21 kB - 05/31/2023 at 15:25

Preview
Download

Adobe Portable Document Format - 27.36 kB - 05/19/2023 at 16:08

Preview
Download

opArt-pcb-3d.jpg

PCB 3D view in KiCad

JPEG Image - 184.61 kB - 05/10/2023 at 00:59

Preview
Download

View project log

  • 1
    Setting up Op Art

    What you'll need

    1. Op Art board
    2. two AAA batteries
    3. two BNC test cables
    4. Oscilloscope with X Y display mode

    Don't forget the batteries

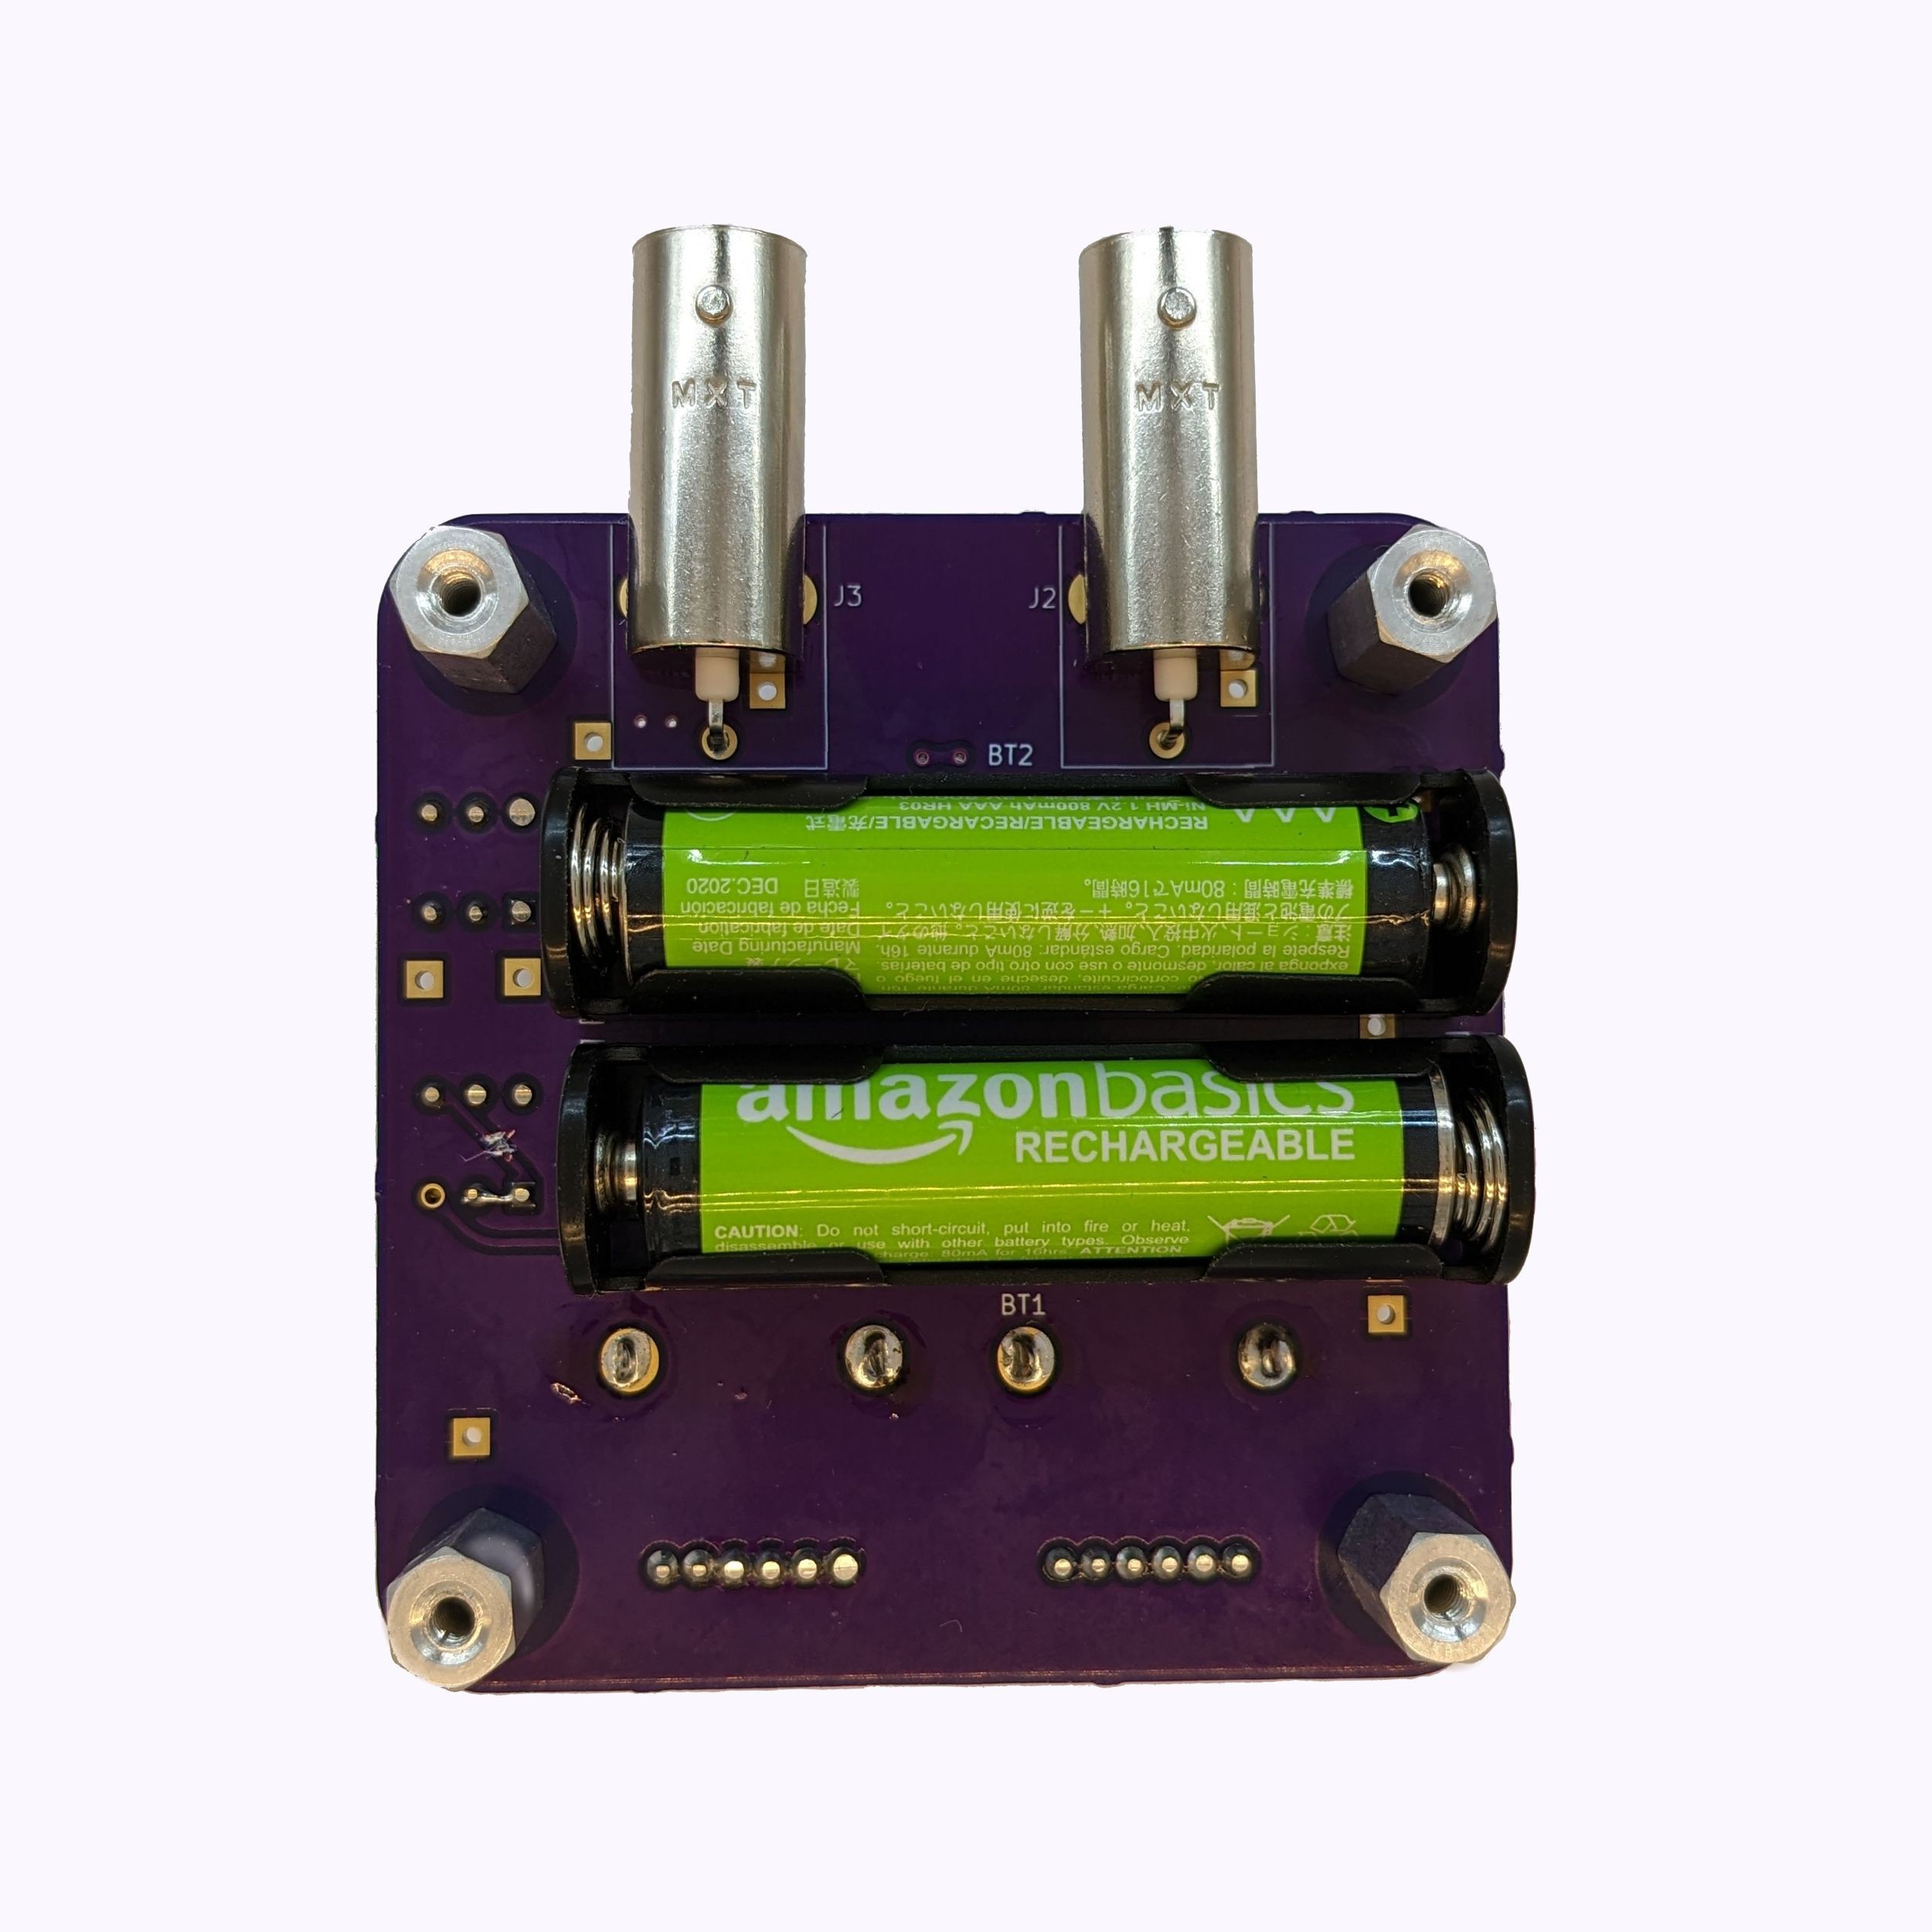
    Install two AAA batteries into the sockets on the back of the PCB, being careful to install with the correct polarity.  There are small +/- indicators on the silkscreen at each end of the battery sockets.

    Connecting Op Art to the oscilloscope

    Connect one BNC cable from the BNC connector labelled "X" on Op Art to the oscillscope's channel 1 input.  Connect the second BNC cable from the connector labelled "Y" on Op Art to the oscilloscope's channel 2 input.

  • 2
    Using Op Art
    • Oscilloscope setup

    Set channel 1 and 2 inputs to 1MΩ input impedance. 

    Configure your oscilloscope up to X Y or versus mode.  in this mode, the oscilloscope will plot channel 1 versus channel 2, with channel 1 defining the x-coordinates and channel 2 defining the y-coordinates.  Setting up this mode varies across oscilloscope models, so you may need to refer to the oscilloscope's manual.

    Running Op Art

    Power up Op Art.  The LED indicator should light.  You should see a pattern appear on the oscilloscope.  Adjust the channel vertical scales to fit the pattern to the screen.

    Setting curve type

    Op Art can be configured to display either hypotrochoids or epitrochoids.  Use the "HYPO/EPI" switch to select one or the other.  Op Art will draw hypotrochoids with the switch in the upper positions and epitrochoids when the switch is in the lower/depressed position.

    Adjusting patterns

    Use the MIXING knob and FREQUENCY knobs to adjust the pattern types.  Note that the frequency knob is very sensitive.  I recommend adjusting the frequency very slowly to generate different pattern types. 

  • 3
    Generating special curves (deltoids, astroids, roses, etc.)

    Hypotrochoids and epitrochoids can take many forms.  With the right set of parameters, they can trace out many interesting patterns such as those shown below.  You may come across them when twiddling Op Art's controls.   There is also a shortcut to generating special cases of your choosing if you run out of patience like I did.

    Trial and error method: With enough twiddling of the controls you'll come across the many special case patterns. However, you'll need patience and a steady hand since the patterns are very sensitive to frequency adjustment.  I recommend starting with the mixing knob near its center position.  Leave the mixing knob as is, then rotate the frequency know very slowly.  When you see a pattern of interest start to come into view, carefully tweak the frequency knob around that point.  Then adjust the mixing knob to adjust its appearance a bit.

    Shortcut: Finding special patterns by trial and error can be tedious. Luckily there is a shortcut.  The special case patterns occur at specific frequency ratios.  For example, the deltoid pattern at the very left of the diagram above occurs when one oscillator frequency is double the other's.   You'll need to do some probing to determine the oscillator frequencies.  Op Art has some test points for this purpose - TP1 for the fixed oscillator and TP2 for the variable frequency oscillator.

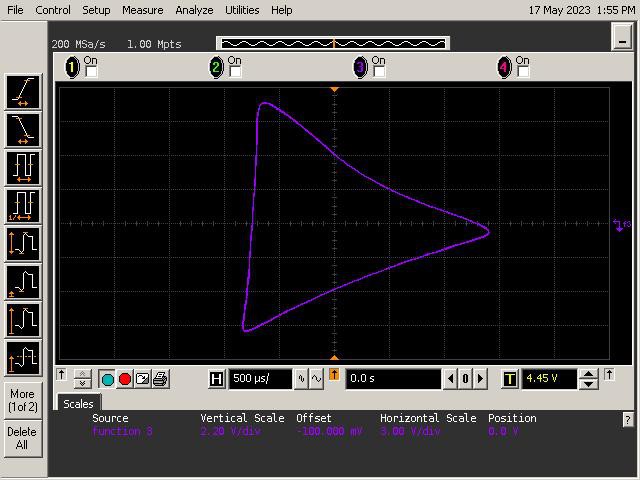
    Let's try it out for generating a deltoid.  First, probe the fixed frequency oscillator output at TP1, either with a  frequency counter or a scope with frequency measurement.  Take note of the exact frequency, which should be around 312Hz, but can vary a bit from board to board.  Next, probe the variable frequency oscillator at TP2.  Use the frequency knob to adjust the frequency at TP2 until it's exactly double the frequency at TP1.  With Op Art's outputs connected to the scope in X Y mode, you should see a three sided or three lobed pattern appear.  Adjust the mixing knob until a deltoid forms.  

    You can use the same procedure for other patterns - just adjust the frequency ratio as needed.  I recommend referring to the tables on the following pages for a full set of frequency ratios and their corresponding families of curves: Mathcurve Hypotroids Page and Mathcurve Epitrochoids Page.  I've listed a few pattern types and their frequency ratios below.

    A few yypotrochoid patterns and corresponding frequency ratios:

    • Deltoid and various three lobed patterns: freq. ratio 2:1
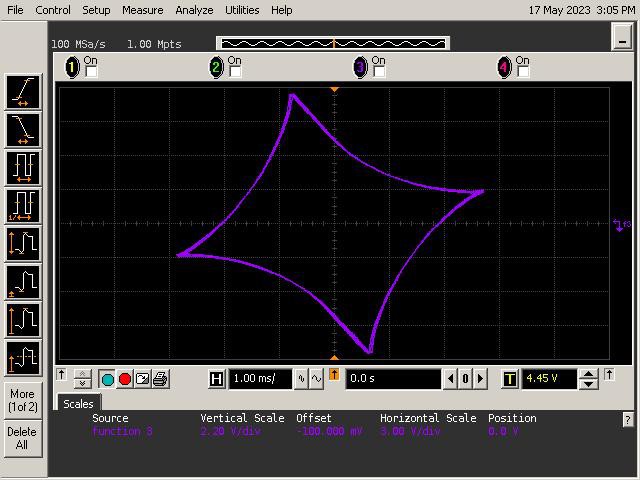
    • Astroid and, square, and four lobed patterns - freq. ratio 3:1
    • Five cusped star and five lobed patterns: freq. ratio 4:1

    A few epitrochoid patterns and corresponding frequency ratios:

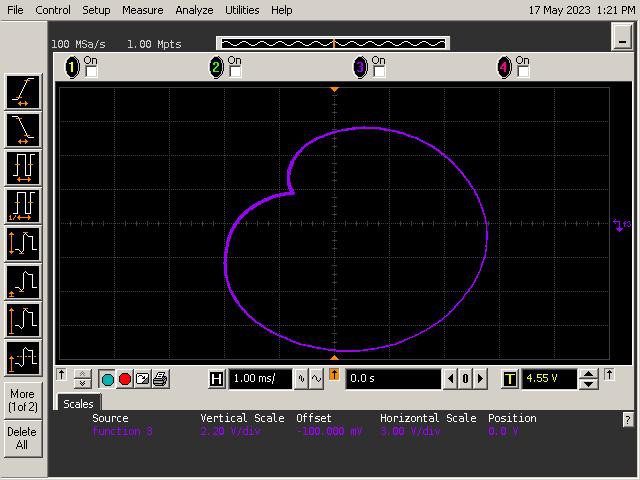
    • cardioids and other limacons: freq. ratio of 2:1
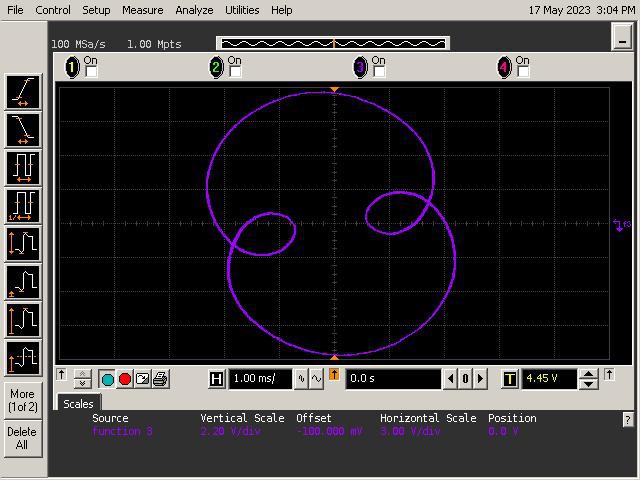
    • nephroids and other two lobed patterns: freq. ratio of 3:1
    • various three-lobed patterns: freq. ratio of 4:1

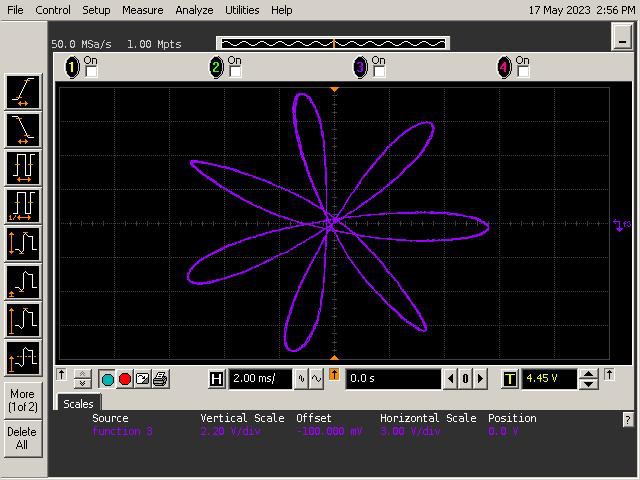
    Here are some examples of special curves generated with Op Art:

    Petal rose
    Petal rose
    Cardioid
    Cardioid
    Nephroid
    Nephroid
    Astroid
    Astroid

View all 3 instructions

Enjoy this project?

Share

Discussions

Similar Projects

Does this project spark your interest?

Become a member to follow this project and never miss any updates